Recommendation System for Anime
Aaron Gokaslan, Ahmad Najeeb,
Haris Chaudhary, Nicholas Hartmann
Abstract
Our objective for this project was to build a recommendation system specifically for Anime TV programs. The end goal was that users should be able to provide their ratings/preferences, and our recommender should be able to use that data to offer some anime recommendations for the user that’s relevant to them. To build an effective recommender, we needed a big dataset so that our recommender is able to work accurately. We obtained data containing information regarding approximately 12,000 animes, over 3 million users, and approximately 170 million user ratings, each of which is between 1 to 10.
Using an Incremental SVD Julia package, we built a model that uses the ratings and anime characteristics to predict what score each user would give each of the animes that s/he has not yet rated. Our final product is a web application that operates through two modes: 1) User based: users can provide their MyAnimeList.net username, and our recommender looks up their profile and compiles a list of Animes which it predicts the user will like (based on their previous ratings). 2) Cold-Start: If a user doesn’t have a MyAnimeList.net account, they can simply provide up to 5 Animes which they’ve previous seen and liked, and our recommender will use this list to prepare recommendations for them.
Dataset Information
Our dataset originates from MyAnimeList.net, which is roughly the IMDB equivalent for Anime. The dataset we obtained could be broken down into two main categories:
- Anime information: Information relating to specific Anime shows, such as their age rating (i.e. G, PG, PG-13, etc.), their runtime, etc.
- User ratings: Ratings which users have given to a specific Anime show.
All of our above data originated as JSON files which we had to extensively clean and eventually convert to CSV. When cleaning, we had to remove Manga information from the Anime information (since Manga is data that we’re conceptually not interested in). We also removed Anime entries that did not have ratings or other vital incomplete data. Correspondingly, all entries in the user information pertaining to the removed entries in the Anime CSV also needed to be cleaned up as well.
Obtaining the Data
Due to an unfortunate history of DDOS attacks, MyAnimeList.net is very careful about who they give APIs keys. Only a handful of third parties have them, and the website no longer gives them out. However, this project was not the first of its kind. Other recommenders had been built using data from the website. After looking around, our group contacted the owner of the recommendation engine, and they mentioned how they still had an API key and could actively pull ratings. Additionally, the owner also had a sophisticated scraper to pull data from the website not covered by the limited API. After contacting him, we were able to receive a dump of the data.
Initial Processing
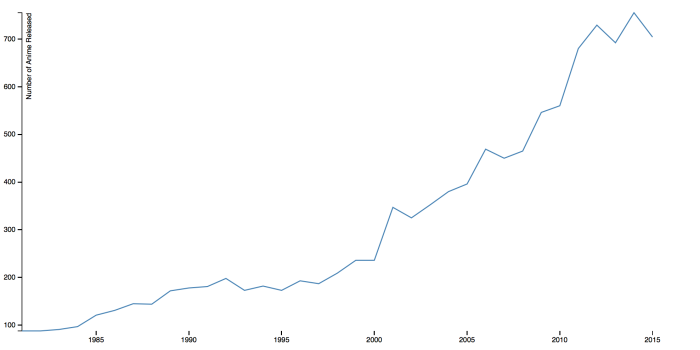
We wanted to start off our research into Anime trends by first doing some basic preliminary work to get a sense of our data looks like, and what can we expect from it going forwards. In order to do this, one of the questions we asked ourselves was how relevant the work we are doing actually is (i.e. are Animes even worth exploring?). We created a line graph to see the trend of new Anime releases and saw a staggering increase over the past two decades. The graph below was adapted from here.

We also were interested in finding out how the average ratings varied per genre to get a sense of what to expect from the underlying data in terms of recommendation. That is, what is the general consensus of users in terms of what is popular or what is not? We were surprised to find however that there was more or less a consistent trend in terms of popularity for the anime’s across a genre. What genre’s did have a low average rating were genre’s that did not have quite a lot of anime. We reasoned that such genre’s are a niche and creating good Anime’s in that category is often a hard task that gets judged more critically by viewers. The results can be seen below, there were adopted and modified from here:

Lastly, another aspect we wanted to visualize was how ratings were distributed across Anime’s themselves. For this purpose we used a Python script to create a visualization that would show us how the number of Anime were clustered around the score. The graph can be seen below. We found that generally most anime were rated around the 7 range. There was no significant high or low rating at all. This seemed to suggest that the overall ratings were not polarized in any way at all.

First Steps with Recommendation
With our initial research out of the way, we eventually started researching about how to build an accurate recommendation model, and this took a decent amount of time. To evaluate the effectiveness of any model that we came up with, we wanted to compare the ratings that we predicted to the actual user ratings. Each time we did this, we split our ratings data into training and testing subsets. After training the model on the training set, we attempted to predict the ratings in the testing set. We used the mean-squared-error as our measure of accuracy. To establish a benchmark to beat, we predicted the ratings using the methods in the table below, and got their respective MSEs:
| Prediction Method | MSE |
| Assign Random Rating Between 0 and 10 | 25.10 |
| Assign Rating of 5 (“middle” rating) | 15.17 |
| Predict average rating given for that anime in the training set | 13.66 |
Recommender #1: pyFM
Our first attempt was to implement factorization machines with the help of the pyFM library (https://github.com/coreylynch/pyFM). A factorization machine is a variation on a support vector machine that handle high levels of sparsity well. With so many dimensions in our data, factorization machines seemed to be a good approach. However, we ran into issues with speed and memory. We could only run the code successfully on a small subset of the data. Additionally, this method only took into account user ratings, and we wanted to incorporate anime characteristics to improve our predictive power. We moved on from this approach, but achieved a MSE of 8.99 when building the model with a random subset of the ratings, so we kept that as a target benchmark to beat.
Recommender #2: MLlib via Spark running on AWS
We also set up an AWS instance and managed to get Spark running on the cluster. Our attempt was to test the MLlib library for training a recommendation engine. We tested some recommendation based on user profiles we received from people we know. We initially received results which were not too satisfactory. On further scrutiny and exploration we considered changing our technique. We were initially using an explicit feedback system that only took into account user scores. This did not take into account factors such as if the series was actually watched when rated, and so on. Another major problem was that ratings were mainly available for relatively more popular shows (because those are the shows that most people watched and rated highly), so the recommendation engine preferred recommending popular shows more, even when recommending a not so well known show made sense. We chose to adopt an implicit feedback system with a scaled score between 0-1 that was formulated using factors such as rating of the show, whether it was actually watched or not, and potentially what genres it belonged to, etc. We experimented with different implicit feedback values to see how it decreased our Root Mean Square Error (RMSE) (if at all) and also how the recommendations were changing. We managed to achieve a very satisfactory result however it came at the cost of running an expensive Spark Cluster. We tried to see what other option we could explore that gave us results that were just as satisfactory but did not need the processing power of a costly AWS setup. With this mission in mind, we plunged forward.
Recommender #3: RecDB
We tried to use RecDB as a suitable alternative for recommendation. It is an open source recommendation system built on top of PostgreSQL and has a number of options for different recommendation algorithms. The primary advantage of this approach was the ease of communication for recommendations (they could be written in the form of SQL queries). The database centered implementation also promised speed, particularly because we could train a model a priori to give faster recommendations. However after a lot of tinkering around we could not get it to work due to some issues with the implementation. After mailing the developer-list a few times we decided to move forward with other options.
Recommender #4: Simon Funk SVD (our final model)
Our final model uses the Simon Funk Singular Value Decomposition Model, implemented in Julia. This model allows us to combine user ratings and anime characteristics (genre, etc.) to make recommendations. Using the IncrementalSVD package in Julia, we were able to make predictions about how individual users might rate new items, as well as identify different features in our data that have the most predictive power.
Our recommendation engine has two functions:
- Recommending Animes to existing MyAnimeList.net users: Given a user’s ID and his ratings for various animes, we predict his score on all animes that he has not yet seen, and recommend the animes with the highest predicted ratings.
- Recommending Animes to a user based on Animes that they already like: Using the item-item similarity function in the Julia package, we recommend the most similar Animes to the ones the user specified.
Results and Evaluation
Using the Julia IncrementalSVD package described in the above section, we achieved an MSE of 7.29 (or RMSE of 2.7). This means that on average, the rating that our model predicts a user will give to an anime is only off by 2.7 points. The heatmap below shows a visualization of our results. It represents a confusion matrix for a random subset of our ratings/predictions where the vertical axis is the rounded score that our model predicts a user will give to an anime, and the horizontal axis is the actual score that the user gave. The “hotter” the square, the more frequent the intersection:
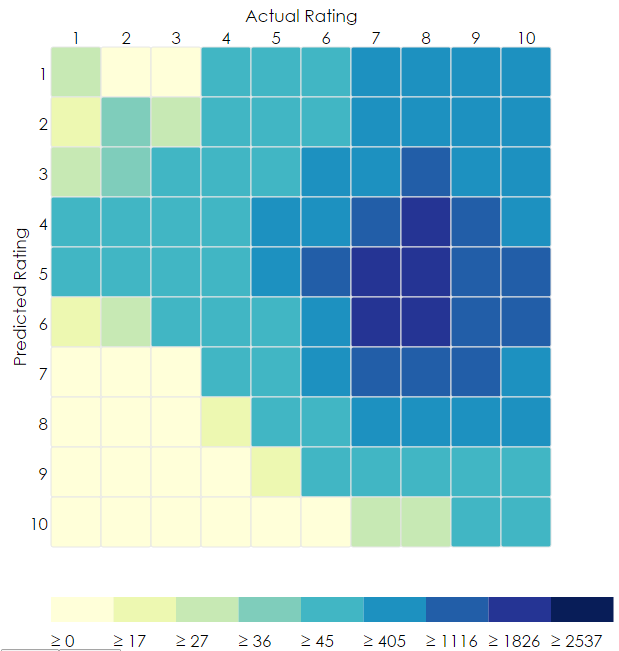
Ideally, we would like to see a diagonal trend from the upper left corner to the lower right. This trend is somewhat present in our heatmap, but we have some unexpected ‘heat’ in the upper right hand corner. It is difficult to say what might be causing this.
This appears to be an innate bias in our data set that we struggle to account for. One likely explanation is that certain shows have cultlike followings that cause a show that the model anticipates to be bad actually turns out good. The most likely explanation has to do with the scale itself. Most recommendations rely on a consistent and easily parsable 5 score scale. A show can either be very good (5), good (4), ok (3), bad (2) or very bad (1). This scale works well to record general sentiment because it leaves a very little degree of confusion for the user as opposed to a 10pt one. Some user will rate a show they find average as an 8, while other users will rates these shows as low as sixes. Simply put, there is no well defined expected value of an unknown show and this makes the task of machine learning quite difficult. Furthermore, this is the minimum RMSE error we could obtain using Netflix’s algorithms. One interesting conclusion to draw from this data, is that Netflix’s algorithms do not work well on this particular dataset as seen by this bias that were unable to resolve be reformating the data or modifying the hyperparameters.
One possible solution is to rescale the scores between 1 – 5, but even for humans this is difficult. One user’s seven could serve as another user’s eight.
Overall, we are happy to have a RMSE of 2.7. We have learned that ratings are difficult to predict, but after trying several models and experimenting with optimizing parameters, this was the best we did.
It is difficult to find a metric to evaluate the performance of the ‘cold-start’ mode in our application (Cold-Start is when a user manually specifies which Animes they already like without specifying a MyAnimeList.net username). For this mode of operation, we simply find those Animes that are the most similar to those that the user inputs, based on the cosine similarity function applied to find similar users and items. We did, however, decide to compare our recommendations with user-provided recommendations on MyAnimeList.net. The site allows users to suggest shows that one might like if s/he likes another given Anime. We were able to scrape the site to get the list of the most frequently recommended Animes (given by users) for each Anime on the site. We then compared our list of recommendations (similar items) with the list of user-provided recommendations scraped from the site. The graph below shows the distribution of the percentage overlap (i.e. what percentage of our recommendations appeared in the list of user recommendations) for a set of 60 of the most frequently rated animes:
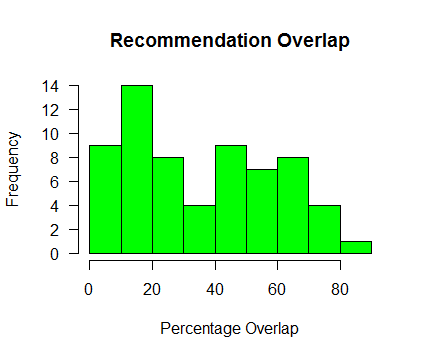
We see from the graph that in general there is a non-trivial amount of overlap between our recommendations and the recommendations that users gave on the site. Although this is not exactly a measure of “accuracy” of our recommendations, it is reassuring to see that users knowledgeable about the Animes on the site often suggest some of the same shows that our ‘Cold-Start’ model does.
Our Application in Action
On the main screen, choose “I’m a MyAnimeList.net user” or “Cold-Start” mode and enter the appropriate information:


Hit Submit and view your recommendations:


The graph at the bottom shows the top 5 genres that we recommended for the user. Mousing over one of the bars reveals a tooltip of the number of animes we recommended within that genre.
Conclusion
We are satisfied with our Data Science project. We believe that we met our 100% deliverable standard, which was to use all of our data to make a recommendation engine incorporating both user ratings and anime characteristics, and to present our recommendations in an application. We also made a step towards our 125% deliverable goal, by creating the top genre interactive visualization which accompanies the recommendations.
An idea for further improvement would be to enhance our cold-start feature. We could allow the user to enter not just titles of animes, but also their personal ratings. Incorporating the ratings we could perhaps weight the different titles differently and adjust our recommendations or at least sort them by appropriateness. We could also attempt to figure out how to treat the cold-start user as an existing user, and try to make recommendations by predicting his ratings on new titles (as done in the “existing user” mode).
APPENDIX: Code and Data Descriptions
- user_extractor.py parses the json anime file to remove Manga and other unwated anime data and produce a concise CSV file
- anime.csv is produced by user_extractor.py. It is a CSV file containing characteristics of the animes, including genre, image, average user rating, etc. to display as part of the results in the application. This file was loaded into SQL as the “animes” table.
- cold_start.jl finds the 10 most similar animes for each anime and produces a text file, which is processed into a csv by similar.py. The output file is similar_animes.csv, which contains an anime followed by its 10 cold-start recommendations separated by pipes (“|”). This CSV was loaded into SQL as the “similar” table, and used for making cold-start recommendations.
- Website code: Our website was made using PHP and MySQL. All the files used for our website are inside the Website/files/ folder (inside the ‘Code & Partial Data’ RAR file). Additionally, inside the Website/database_backup/ folder (inside the ‘Code & Partial Data’ RAR file), you’ll find a file called anime.sql. This is a complete backup of our MySQL database that is used for ‘lookup’ features of our website (e.g. to map a MyAnimeList.net username to a user ID, to provide drop-down texts for text fields, to get ‘Cold-Start’ recommendations, etc.).